
· blog · 8 min read
The most famous GOTV result, and what it is worth in November
How a single primary election in Michigan thrust a new tactic into the forefront of political campaigns — and why that's a problem.
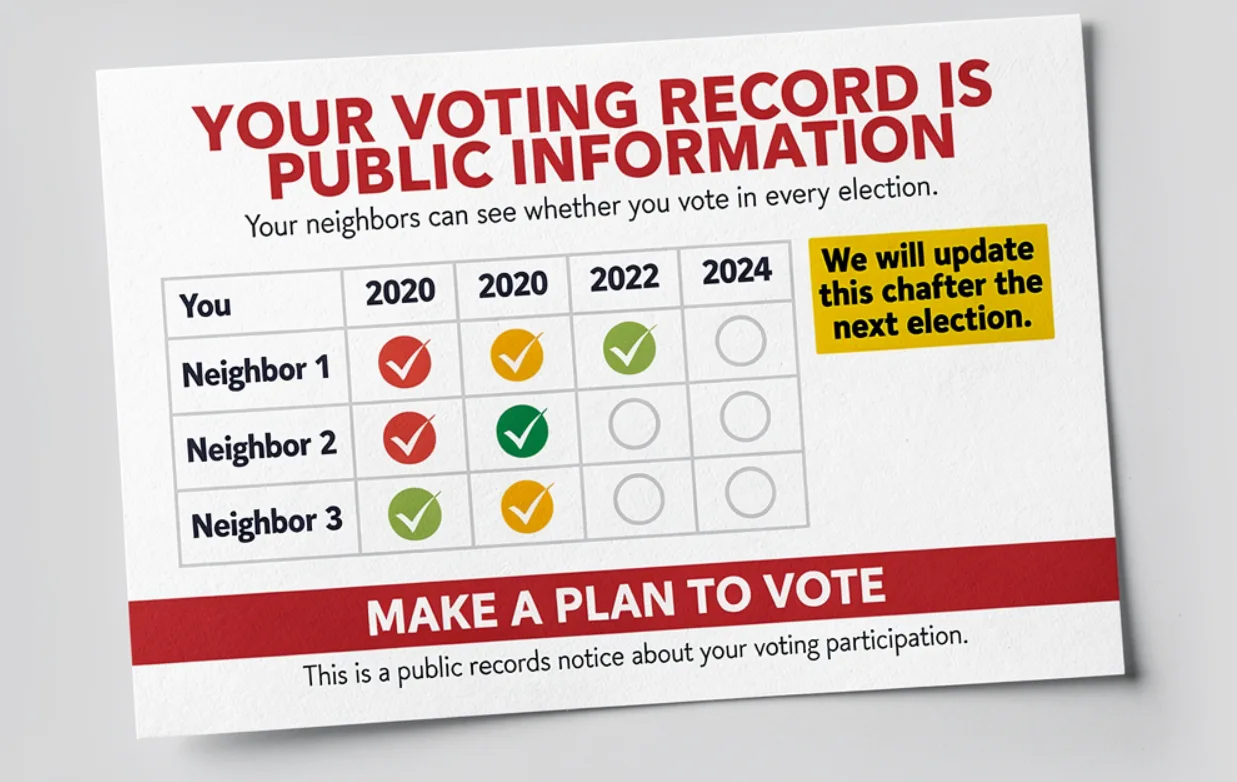
In August 2006, in a Michigan primary, a social-pressure letter that showed people their voting record raised turnout by 8.1 points. It has become the most famous and one of the most quoted numbers in political campaigning.
And it's mostly wrong.
Researchers mailed 180,000 households a single sheet of paper. It listed who in the household had voted in past elections, and who on the street had, and it promised to send an updated list after the election. Turnout among the people who got it rose 8.1 percentage points. The letters cost 30 cents each. The paper worked out the cost at $1.93 per extra vote.
Nothing in field organizing had come close. The letter became a fixture of every GOTV training deck, and “social-pressure mail” became a product line.
If you are planning a November program around that number, you will be disappointed. Here is what the evidence says it’s worth in a midterm, and why the same thing is quietly true of your door program too.
The number shrinks when the election matters
That Michigan election was a primary. Control-group turnout was 29.7%. Nothing else was competing for anyone’s attention.
In 2014, a team led by Alan Gerber ran the same idea at scale in a November midterm: nearly two million people across 17 states, each sent a “report card” showing their own voting record. The effect was 0.7 points. In the states with the most competitive races it was 0.3. In one state, Alaska, the letter lowered turnout by 3.2 points.
In 2010, another midterm, Gregg Murray and Richard Matland sent social-pressure mailers in Wisconsin and Texas. The letters raised turnout about 1.5 points. That’s real, but the plain civic-duty letter in the same experiment did just as well. In the authors’ words: “No evidence suggests a social pressure message is more effective than a generic civic duty message.”
The best summary of the whole literature is a 2024 meta-analysis by Christopher Mann and Katherine Haenschen. They re-sorted 240 U.S. experiments by whether they ran in a high-salience election (a November with U.S. House seats on the ballot) or anything else. Social-pressure mail averaged 2.45 points in low-salience elections and 1.38 in high-salience ones. That second number rests on only five experiments, and only one in a presidential year.
So the honest November range for a social-pressure letter is somewhere between about 0.7 and 1.4 points per person you mail. That’s a sixth of the famous number, or less.
Your doors shrink too, and that part never gets said
Canvassing results are usually quoted a different way, and that hides the same problem.
A door-knocking effect is normally reported among the people you actually talked to. Mann and Haenschen put that at 4.6 points in low-salience elections and 3.05 in high-salience ones. But you don’t talk to everyone on your list. Contact rates have historically run 25–30%. In a large, carefully run 2025 Virginia program, the canvass reached 15.9% of the people it was assigned.
Per person on your walk list, then, a November door program is worth roughly 0.5 to 0.9 points. Mann and Haenschen calculate that for doors to match a social-pressure letter in a high-salience election, your canvass would have to reach more than 45% of its list. Very few programs do.
That Virginia program is the cleanest recent test. It was a 2025 randomized trial run by the Virginia League of Conservation Voters PAC, covering more than 300,000 voters. Canvassing raised turnout 0.4 points, and the mail program raised it 0.4 points. The report puts the cost at $2,638 per extra vote for canvassing and $524 for mail.
What a point is worth, in letters and doors
The easiest way to compare is to ask how many people you need on the list to produce one extra vote.
| November, per extra vote | People on the list | Why |
|---|---|---|
| Social-pressure letter | ~70 to ~145 | 1.4 to 0.7 points per person mailed |
| Door-to-door canvass | ~110 to ~200 | 3.05 points among those reached × 16–30% reached |
| Ordinary mail piece | ~360 | 0.28 points (Mann & Haenschen, high salience) |
Multiply by what each costs you. A letter at 75 cents comes to roughly $50 to $110 per extra vote. A door costs a printed list, a trained volunteer or paid canvasser, and their time. Most campaigns already know which of those is cheaper.
None of this means stop knocking doors. Doors do things a letter can’t. They recruit volunteers, persuade people, find out who your voters are, and build an organization that lasts past November. But if the only job is turnout, and you have a fixed budget in the last three weeks, a door program is not automatically the stronger choice. Per voter on your list, a well-made letter has done about as well or better, for much less.
The catch: people don’t like being watched
Social-pressure mail is not free of side effects.
In the Michigan study, many people who got the neighbors version called the number on the mailer to complain and demand to be taken off the list. In a separate test, Matland and Murray showed people a postcard with a voting record on it, attributed to a candidate. Ratings of that candidate fell from 50 to 40 on a 100-point scale, and people said they were angrier and more likely to call and complain.
Turnout itself has held up in most tests. A 2007 Kentucky experiment aimed at people who hadn’t voted the year before found gains of about 2 points and no drop in turnout. Alaska in 2014 is the exception that should keep you careful.
Three practical points follow:
- Don’t send it from your candidate. In the Matland and Murray test, the anger landed on whoever signed it.
- Show their own record, not their neighbors’. The neighbors version was the strongest and also the one people complained about. The 2014 midterm test used only the milder self version.
- Thank them instead of scolding. A 2016 presidential-year test in North Carolina sent letters that thanked people for past voting and showed their record. Two letters raised turnout about 1.2 points. That’s in line with the midterm evidence, with a gentler tone.
What to take into the next three weeks
- Plan with November numbers. If your model assumes a letter is worth 5 or 8 points, or a door is worth 4, you’re working from primaries and from people who answered the door. For a midterm, plan on roughly half a point to a point and a half per person targeted, whatever the channel.
- Compare channels per person on the list, not per conversation. That one change reorders most budgets.
- If you use social pressure, use the mild version from someone other than the candidate.
- Know how thin the ice is. There are only five high-salience experiments on social-pressure mail and one in a presidential year. Most canvassing evidence is more than a decade old, from before contact rates fell. These are the best numbers available, and they could move.
Sources
| Claim | Source | Figure as reported |
|---|---|---|
| Michigan primary letter | Gerber, Green & Larimer (2008), American Political Science Review 102(1) | Neighbors +8.1 pp; Self +4.9; Civic Duty +1.8; control turnout 29.7%; 180,002 households; “30 cents apiece”; Neighbors “$1.93 per vote”, Self “$3.24 per vote”; complaint calls, p. 40 |
| 2014 midterm, 17 states | Gerber, Huber, Fang & Gooch (2017), American Politics Research 45(4) | +0.7 pp (s.e. 0.001), n = 1,969,899, control 31.2%; highest-salience group +0.3; Alaska −3.2 |
| 2010 midterm, WI & TX | Murray & Matland (2014), Political Research Quarterly 67(2) | Social pressure +1.46 (WI), +1.50 (TX); generic civic duty +1.23 (WI), +2.11 (TX); “No evidence suggests a social pressure message is more effective…” |
| Meta-analysis by salience | Mann & Haenschen (2024), Electoral Studies 87, 102729 | SP mail ITT 2.45 (n=15 low) / 1.38 (n=5 high); plain mail 0.46 / 0.28; canvassing CACE 4.58 / 3.05; contact 25–30%; doors must exceed 45% contact (high salience) to match SP mail; 1 presidential-year SP experiment |
| Virginia 2025 program | Virginia LCV PAC & Indigo (2025), program evaluation | Canvass +0.4 pp, mail +0.4 pp (ITT, with covariates); contact rate 15.9%; cost per vote $2,638 canvass, $524 mail |
| Backlash against sender | Matland & Murray (2013), American Politics Research | Candidate feeling thermometer 50.1 → 40.3; anger and intent to complain up (lab-in-field, hypothetical candidate) |
| Kentucky non-voters | Mann (2010), Political Behavior 32(3) | Self +2.0 pp among 2006 non-voters (control 6.8%); no negative turnout effect |
| Gratitude framing, 2016 | Bilingual-mail experiments, NC 2016 presidential general (Latino voters; two letters) | English letter +1.2 pp (p = 0.05); bilingual +0.7 (n.s.); control 48.7% |